The title of the work suggests uncertainty or curious repetition. Or perhaps a collapse of the word before it has even left the lips? As a collage of voices blending history, superstition, reality and fiction the worker circles in on the delicate subject of money.
The Stock Exchange in Copenhagen was built by the buoyant King Christian IV, who, due to war debt later in life, had to sell several of his properties, including The Stock Exchange, in order to make ends meet. This happened in 1647; only seven years after construction on the building had finally been completed.
The work is performed in front of a mosaic by Danish artist Boye Givskov, which depicts elements of the history of The Stock Exchange. The work combines stories about money and everyday life, about the Kings daydreams and the unpredictable movements of the stock market – this man-made system, which behaves just as turbulent and unpredictable as the weather.
In 1969 Danish artist Lene Adler Petersen performed her work The Female Christ, in which she walked naked through The Stock Exchange in Copenhagen while carrying a cross. This work stands as a central piece in Danish art history – it was a confrontation of capitalism and disrupted business as usual. P-p-p-pengene builds on this work, but uses a different tactic: As a poetically disturbed lecture or a guided tour during narrative breakdown, the piece invites the audience inside this otherwise inaccessible historical building, which is owned by and serves as head office for The Danish Chamber of Commerce. A gesture with a significant democratic point.
Except from the manuscript:
"Just like the turbulence of the wind or the irregular coastline of Britain, the wild movements of prices in the stock market seem to follow the logic of fractal geometry. Fractals are complex geometrical patterns that exhibit similar patterns at increasingly small scales, like the leaves of a fern or the ice crystals in a snowflake. This is called self-similarity and is also found in stock charts. A chart showing price movements across 10 years is very difficult to distinguish from a chart zoomed in, showing the price movements across one year or even one day. This view of the stock market is known as “wild” because it predicts a far greater likelihood of dramatic events like the crashes of 87, 98 and 08."
P-P-P-PENGENE
Site-specific performance in the Copenhagen stock exchange.
Duration: 30 min.
2020
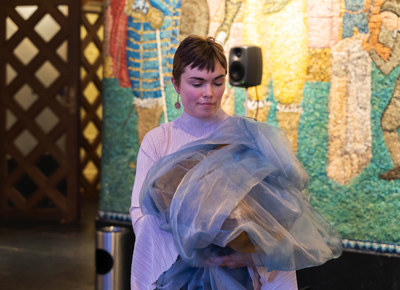
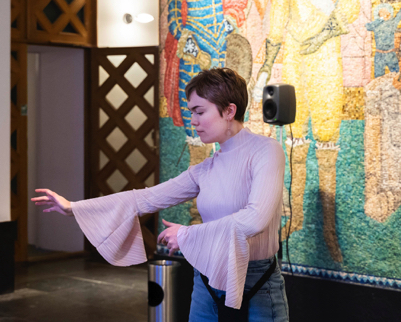
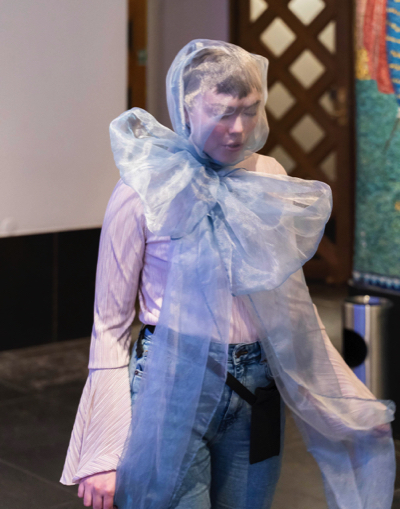
Photo: Rine Rodin